Choose a Delta Funnel Profiling Method
Delta Funnel provides two ways to explore the same ranked profiling data:
- Open the self-contained HTML report for interactive exploration.
- Use the deterministic terminal CLI for scripts and agent-assisted analysis.
Both views start with exact operation and phase timings, then drill into sampled native Rust functions.
Perfetto diagnostics currently require a diagnostics-enabled build on Linux x86_64. Follow Set up Perfetto diagnostics for Python once before using either view.
Pass execution_profile=True for a separate, diagnostics-free path to exact
semantic and operator data. It does not collect native CPU stacks.
Explore one operation in HTML
Create a ranked profile configuration and pass it directly to the operation:
from deltafunnel import RankedProfileConfig

preview = table.preview(
    limit=100_000,
    ranked_profile=RankedProfileConfig(
        "target/profiles/preview.profile.html",
        sample_hz=1000,
        artifact_path="target/profiles/preview.dfprofile",
    ),
)
Open target/profiles/preview.profile.html in a browser. The report is
self-contained and stays on the local machine. artifact_path is optional;
it preserves the same validated ranked model for later terminal inspection.
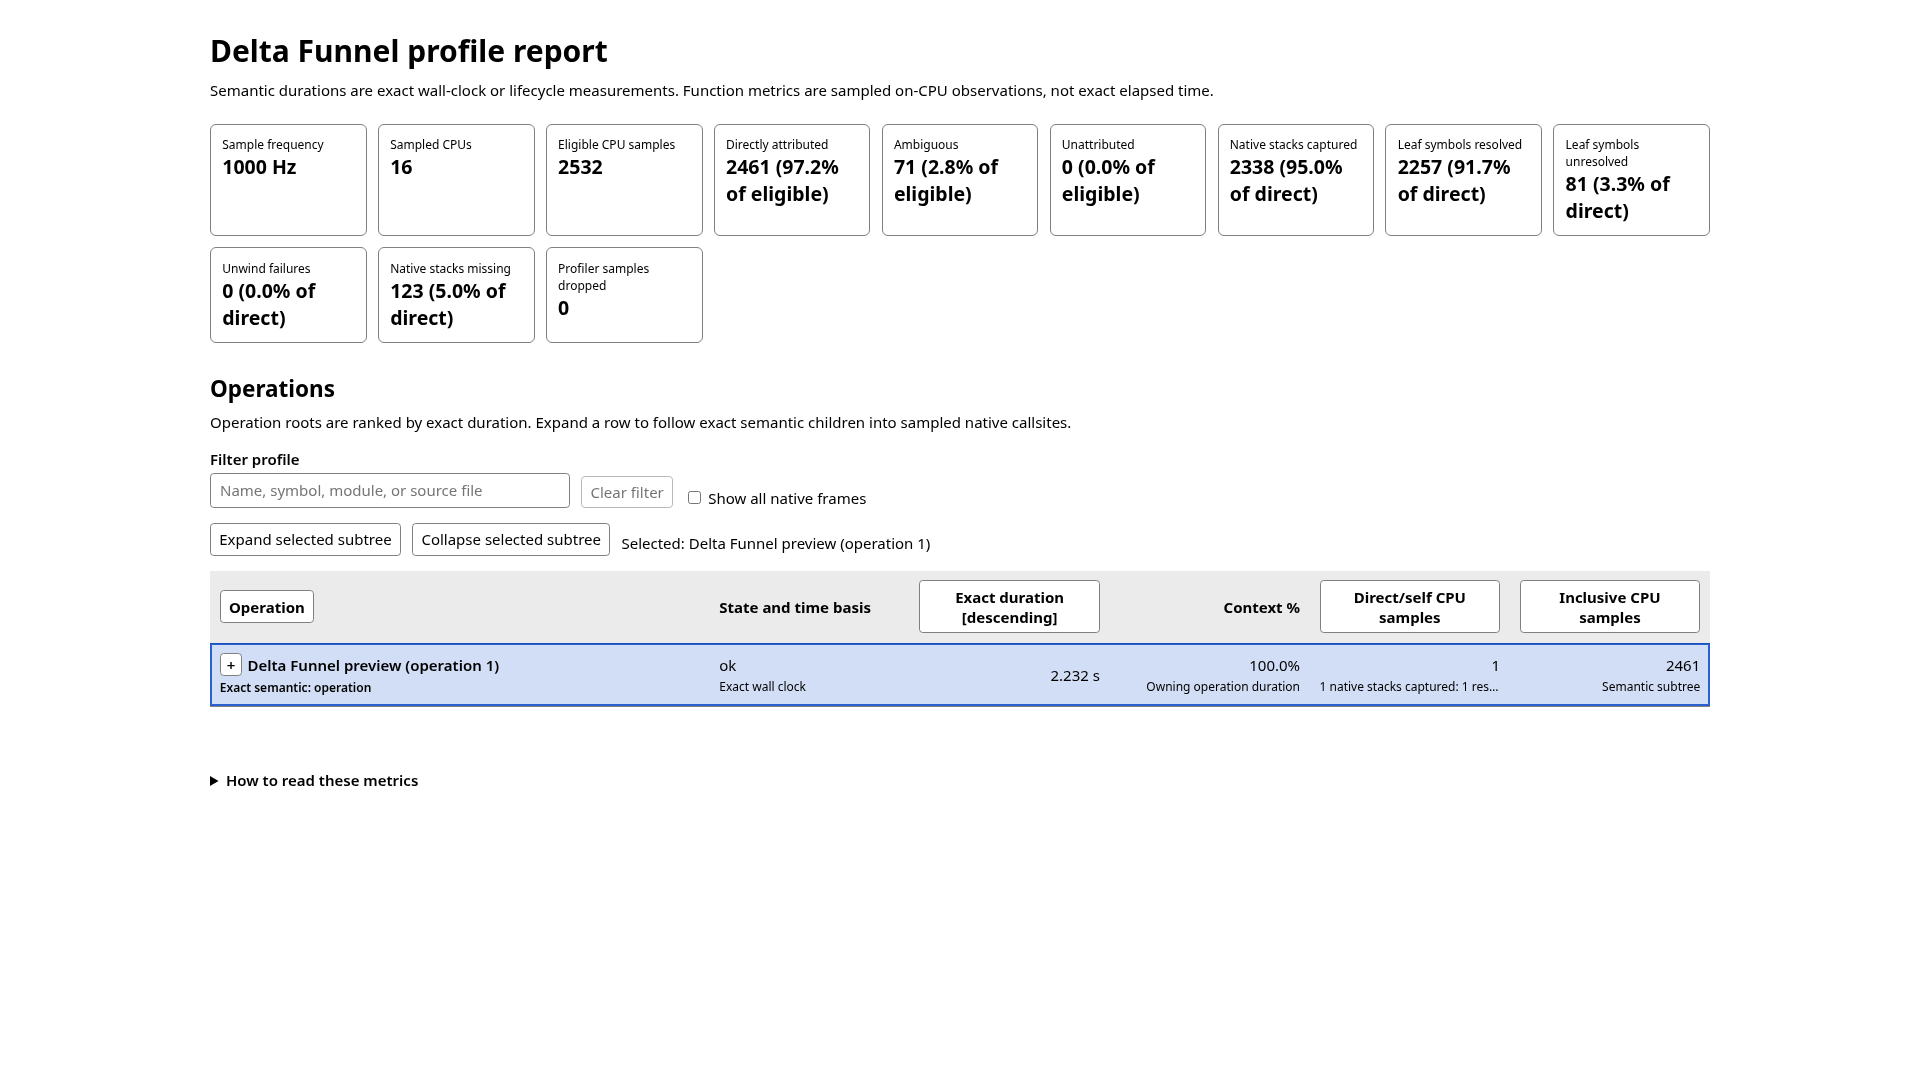
The overview keeps capture quality, filtering, sorting, and the operation ranking in one viewport. Click either screenshot to open it at full resolution.
Start with the operation row. Expand its longest semantic phase, then continue into native function rows. Function children are ranked by inclusive CPU samples by default. Self CPU samples show where samples ended directly.
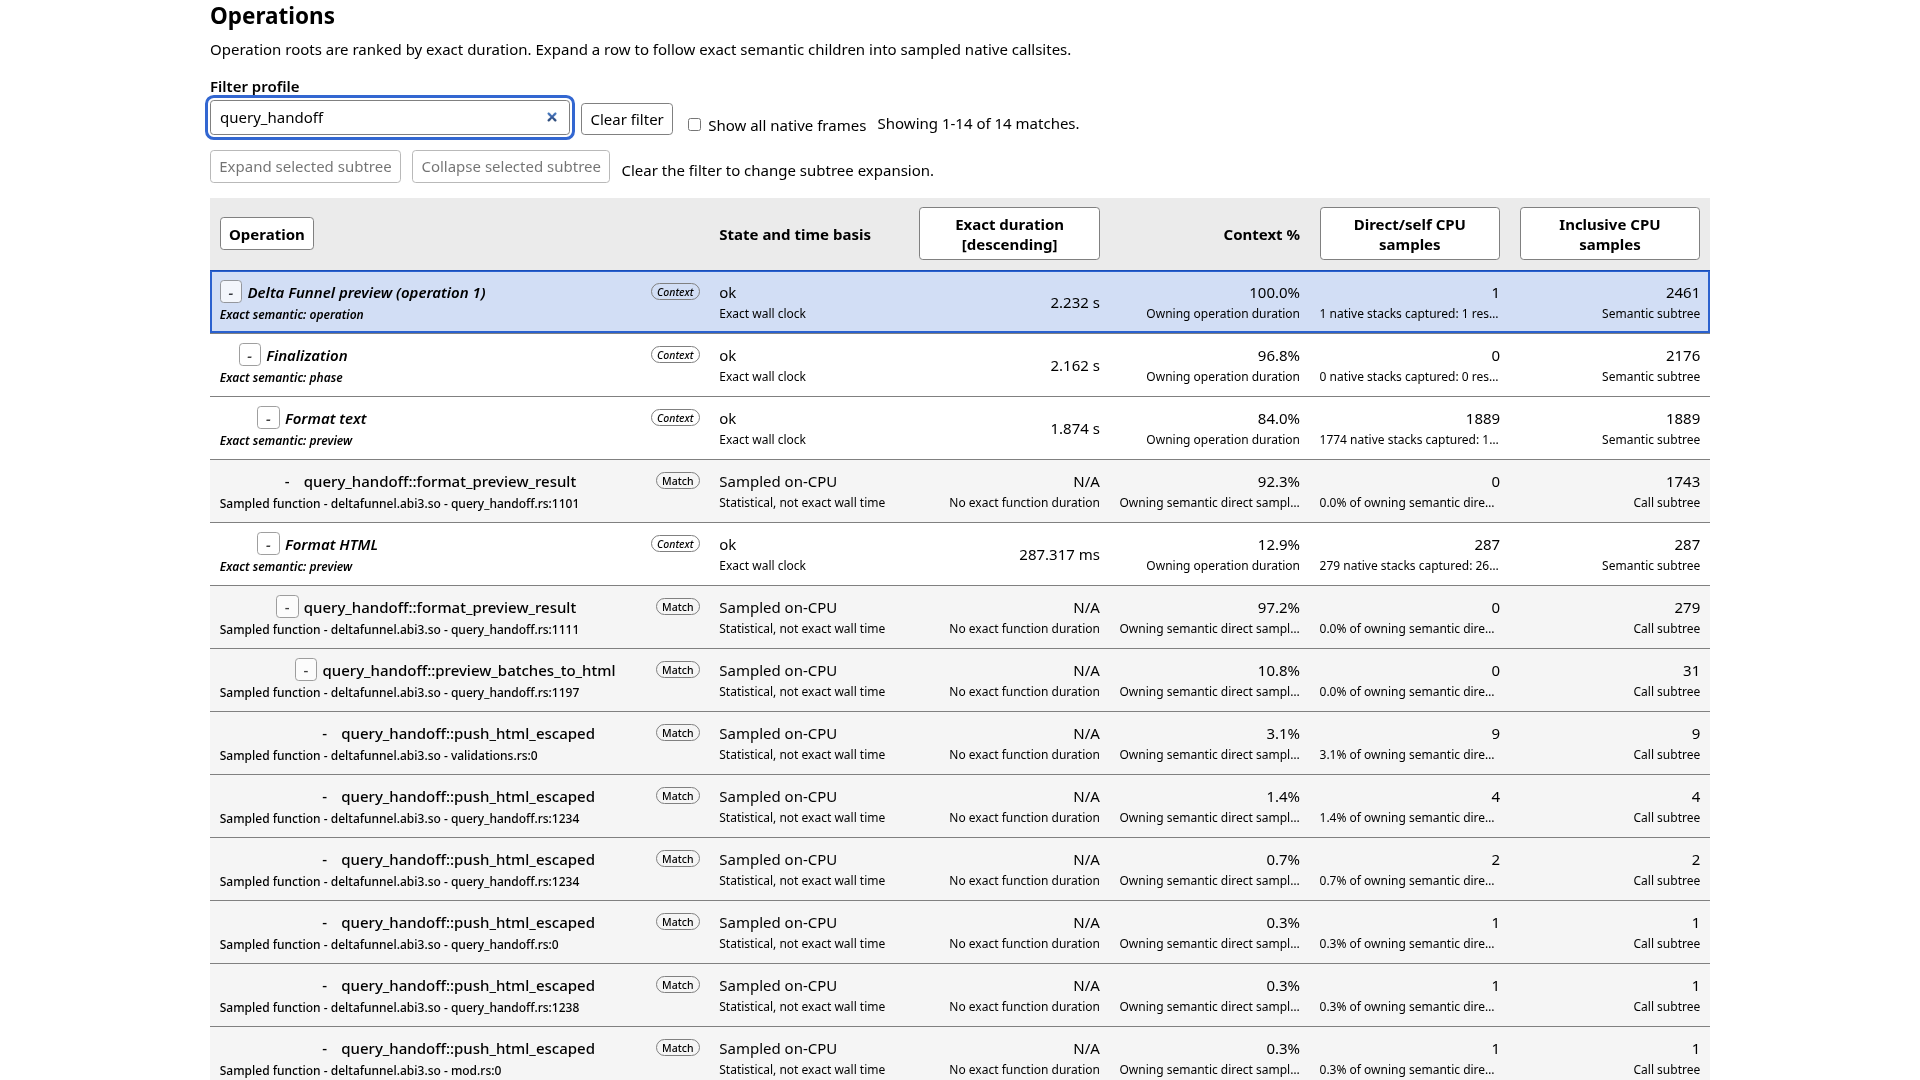
The expanded view follows exact operation and phase rows into sampled functions while keeping exact duration, self CPU, and inclusive CPU separate.
Use 1000 Hz for short investigations that need more native-stack detail. Use 100 Hz to reduce capture volume. Both values are statistical sampling frequencies, not timing precision guarantees.
The same RankedProfileConfig works with Table.write_to_mssql and
Session.write_all. See the complete preview and write examples in
Generate an operation-scoped ranked HTML report.
Investigate with an agent or script
Set artifact_path in the same RankedProfileConfig used for HTML. The
resulting .dfprofile contains the same operation-scoped hierarchy and metrics
without retaining the larger temporary raw capture or repeating Trace
Processor analysis.
Show a bounded one-shot view:
Keep the profile loaded while running multiple commands:
The CLI prints stable identifiers such as semantic:ID and
function:SEMANTIC_ID:FUNCTION_ID. It accepts commands such as open, up,
root, sort, and filter, and terminates every response with -- end --.
See
Inspect ranked results in the terminal
for bounded traversal, exact identity selection, and full command examples.
Read the measurements correctly
| Measurement | Meaning |
|---|---|
| Exact duration | Exact wall-clock or explicitly labeled lifecycle duration |
| Self CPU samples | Samples whose deepest captured function is this function |
| Inclusive CPU samples | Samples containing this function or one of its descendants |
| Attributed | Samples assigned to one valid semantic context |
| Ambiguous | Samples matching more than one valid context |
| Unattributed | Samples that cannot be assigned to a semantic context |
| Unresolved symbol | A native sample was retained, but its function name could not be resolved |
| No native samples | The semantic scope has exact timing but no eligible native CPU sample; this does not prove idle time, I/O, or zero CPU use |
Exact duration and CPU samples use different units. Function sample counts are not exact function wall time. Parallel semantic children may overlap, so their durations may sum to more than their parent.
Linux native sampling records on-CPU work. It does not by itself explain time blocked on I/O, locks, or sleep. Use a deep-system capture and inspect its raw trace when scheduler context is needed.
Choose another mode when needed
| Goal | Method |
|---|---|
| Profile one preview or write interactively | Operation-scoped ranked HTML |
| Inspect the same operation-scoped result from a terminal | Terminal inspector |
| Inspect exact semantic timing without native stacks | Stable semantic JSON |
| Capture several operations or retain a raw trace | Whole-process Perfetto capture |
| Record a workload expected to run for more than two minutes | Streaming Perfetto capture |
| Investigate scheduler and wakeup behavior | Deep-system Perfetto capture |
| Find native CPU hotspots and source lines with a minimal standalone capture | Samply |
The raw .pftrace remains the advanced source for chronology, scheduler, I/O,
and event-level investigation. Use ranked HTML for interactive exploration and
the terminal inspector for deterministic scripted or agent-assisted analysis.
Keep reports private
Profiling artifacts can contain process names, local paths, library names, symbols, and timing data. Keep them local unless they have been reviewed and explicitly approved for sharing.