A laptop beat Serverless Small on selective Delta reads
Delta Arrow Reader ran four pre-existing selective queries from a laptop against private Delta tables in S3. It beat Databricks Serverless SQL Small on all four. Against Lakehouse//RT Small (Beta), it won one query, finished within 10.4% on another and 33.8% on a third, and was 2.33 times slower on the fourth. All four engines returned the same results.
The same-machine comparison was not close. Delta Arrow Reader ran the four queries 4.67, 71.75, 1.26, and 30.48 times faster than delta-rs, which used 6.4 times as much peak memory.
The latency table also understates the result against RT. Delta Arrow Reader selected the same files, transferred half as many reported bytes on Q1, and stayed within 14% of RT's reported bytes on Q2 through Q4. RT was faster overall, but not because Delta Arrow Reader pruned less effectively or moved materially more data. The local process crossed a public WAN to S3; RT's storage topology is not disclosed. The different network paths may account for a meaningful part of the remaining gap, but these measurements cannot tell us how much or separate that effect from differences between the engines.
Databricks positions Lakehouse//RT (Beta) for low-latency application serving over Delta and Iceberg tables in cloud storage, but keeps its implementation inside a managed service. Delta Arrow Reader puts its read path in an Apache-2.0 Rust crate that applications can embed, inspect, and change.
The source tables and SQL are private, so readers cannot rerun the complete workload. They can still audit the comparison: this page publishes every anonymized repetition, the workload shape, timing boundaries, cache checks, and limitations.
Results
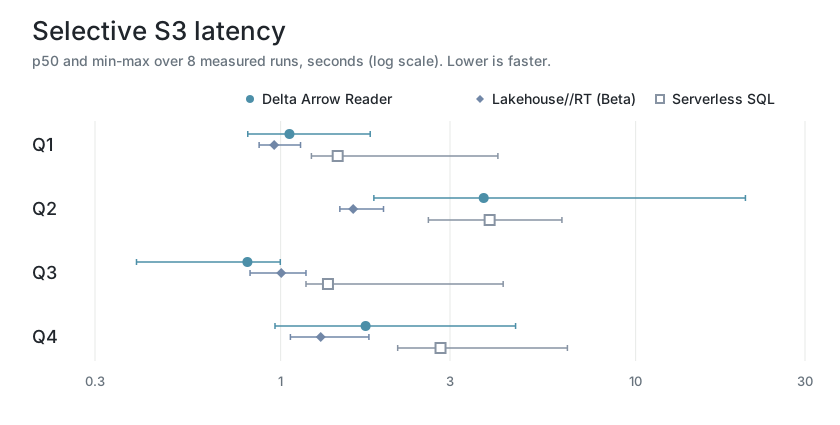
The primary value is connector wall time for the managed warehouses and DataFusion planning plus complete result consumption for the local engines. Each value is the median of eight measured rounds after one discarded warmup. Lower is faster.
| Query | Lakehouse//RT Small (Beta) | Serverless SQL Small | Delta Arrow Reader 0.6.0 | delta-rs main |
|---|---|---|---|---|
| Q1 | 0.959 s | 1.448 s | 1.059 s | 4.950 s |
| Q2 | 1.601 s | 3.880 s | 3.733 s | 267.860 s |
| Q3 | 1.004 s | 1.359 s | 0.806 s | 1.016 s |
| Q4 | 1.297 s | 2.821 s | 1.736 s | 52.899 s |
Delta Arrow Reader finished 1.04-1.69 times faster than Serverless SQL on every query. Against RT, it was 1.24 times faster on Q3, 10.4% slower on Q1, 33.8% slower on Q4, and 2.33 times slower on Q2.
When each query has equal weight, the geometric mean puts Delta Arrow Reader 29.0% behind RT and 28.8% ahead of Serverless SQL. Summing the four medians puts it 50.9% behind RT and 22.9% ahead of Serverless SQL. Both summaries are included because either one alone can flatter a benchmark.
Q2 is the weakest and noisiest Delta Arrow Reader result. Its eight measured runs ranged from 1.831 to 20.386 seconds around a 3.733-second median. The chart shows that range rather than reducing a WAN-sensitive result to one clean dot.
Databricks-reported server time
Databricks Query History also reported total_duration_ms for each managed
statement, recorded as server_seconds in the
public CSV. These are the medians from the same
eight measured rounds:
| Query | Lakehouse//RT (Beta) server | Serverless SQL server |
|---|---|---|
| Q1 | 0.887 s | 1.264 s |
| Q2 | 1.083 s | 3.114 s |
| Q3 | 0.889 s | 1.219 s |
| Q4 | 0.763 s | 2.522 s |
The server metric has a narrower boundary. Databricks defines it as total statement duration excluding result fetch. It does not include client transport or Arrow decoding. Delta Arrow Reader's timer includes planning and complete stream consumption. Because those boundaries differ, the connector wall time above remains the primary application-facing comparison.
The byte counts change the RT comparison
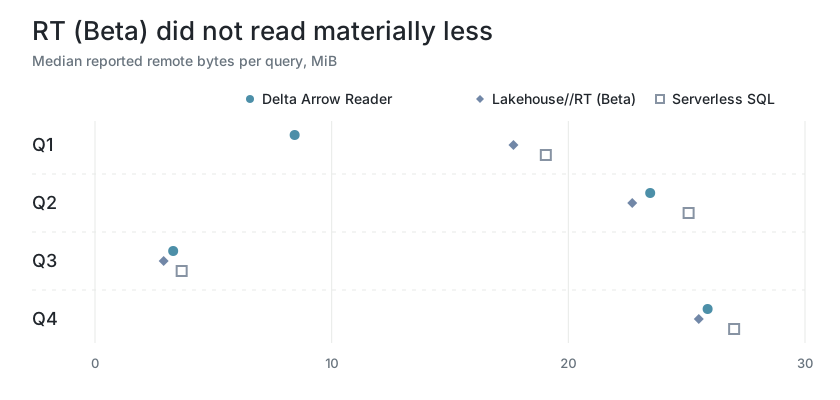
RT won three rows in the wall-time table. That does not mean it did less storage work. The scan counters rule out that simple explanation:
| Query | Delta Arrow Reader | Lakehouse//RT (Beta) | Serverless SQL | DAR vs RT | DAR vs Serverless |
|---|---|---|---|---|---|
| Q1 | 8.436 MiB | 17.681 MiB | 19.049 MiB | 52.3% less | 55.7% less |
| Q2 | 23.459 MiB | 22.700 MiB | 25.082 MiB | 3.3% more | 6.5% less |
| Q3 | 3.303 MiB | 2.900 MiB | 3.662 MiB | 13.9% more | 9.8% less |
| Q4 | 25.885 MiB | 25.510 MiB | 27.005 MiB | 1.5% more | 4.1% less |
Delta Arrow Reader transferred fewer reported bytes than Serverless SQL on every query. Against RT, it transferred less than half as much on Q1 and was within 14% on the other three. Both readers selected exactly the same files. The remaining RT advantage therefore does not point to better file pruning or materially lower data transfer.
One important difference is where the readers ran. Delta Arrow Reader reached S3 from a laptop over a public connection measured at 140.392 Mbit/s with a 0.257-second median time to first byte. RT ran inside Databricks, which does not publish its tested warehouse's network path or storage placement. Network latency and throughput could account for a meaningful part of the remaining wall-time gap, especially for noisy Q2. The counters cannot tell us how much of that gap came from the network rather than the engines themselves.
These counters are also not identical wire measurements. Delta Arrow Reader counts bytes returned through instrumented object-store reads. The managed warehouses report remote bytes from their scan layer. They are strong enough to compare the scale of remote work in this sample, not to claim universal byte efficiency. delta-rs is absent from this table because its benchmark path did not expose an equivalent counter.
The same-machine Rust baseline was not close
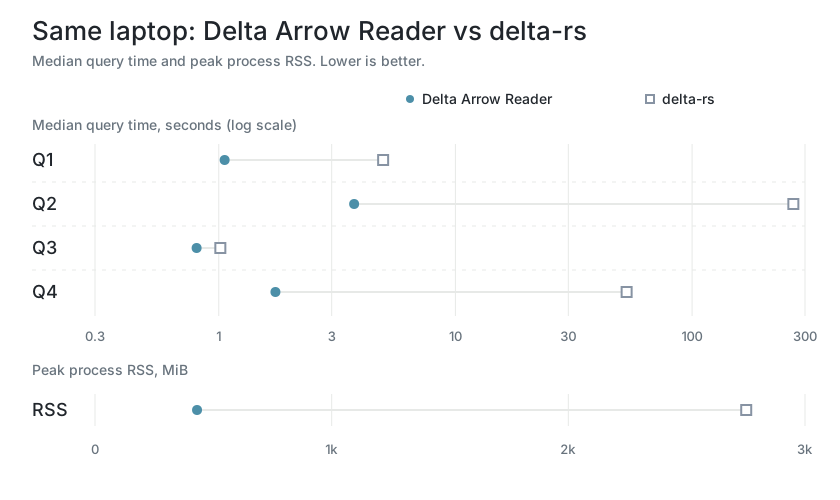
delta-rs ran beside Delta Arrow Reader on the same laptop, against the same S3 objects and pinned Delta snapshots. It executed the same query shapes and returned the same results. That removes the managed-service infrastructure advantage from the comparison.
| Query | Delta Arrow Reader | delta-rs | DAR speedup |
|---|---|---|---|
| Q1 | 1.059 s | 4.950 s | 4.67x |
| Q2 | 3.733 s | 267.860 s | 71.75x |
| Q3 | 0.806 s | 1.016 s | 1.26x |
| Q4 | 1.736 s | 52.899 s | 30.48x |
The memory result was just as clear: Delta Arrow Reader peaked at 431.1 MiB, while delta-rs reached 2,751.6 MiB. That is 6.4 times as much memory for delta-rs.
This is the strongest evidence that the reader itself matters. Rust, DataFusion, and Delta support did not produce comparable performance by themselves. Delta Arrow Reader's selective read path was faster on every query, dramatically so on the two largest tables.
This remains an end-to-end comparison, not a one-component A/B test. The two readers used different DataFusion, Arrow, and Parquet versions, and delta-rs did not expose an equivalent S3 byte counter. Those differences limit which optimization gets credit; they do not explain away a same-machine gap of up to 71.75 times.
The workload was not designed for this reader
These queries came from an existing production sample prepared before this benchmark. The benchmark used all four samples for which the original SQL was available. To run them through DataFusion, it changed table registration and identifier quoting, but did not add or remove filters, projected fields, literals, joins, aggregates, or ordering.
The tables and SQL contain private business details, so the public artifacts use Table A through Table D and Q1 through Q4. No synthetic dataset stands in for the source. A fabricated table with the same schema would not reproduce its clustering, statistics, row distribution, compression, or Parquet page layout.
Table shape
| Table | Active size | Active files | Columns | Column profile |
|---|---|---|---|---|
| A | About 240 MiB | Fewer than 10 | About 120 | Mixed |
| B | About 1.2 TiB | Over 18K | Over 400 | Mostly numeric |
| C | About 800 MiB | About 20 | About 290 | Mostly numeric |
| D | About 200 GiB | Over 3K | About 90 | Mostly numeric |
These source-level figures are rounded to make the private tables harder to identify. The query measurements below remain exact.
All four queries apply two equality filters and one membership filter. The projection and selected-input shape are shown without names or literal values:
| Query | Table | Projected columns | Membership values | Planned files | Selected file bytes | S3 bytes received | Output rows |
|---|---|---|---|---|---|---|---|
| Q1 | A | 16 | 24 values, 20 unique | 5 | 229.9 MiB | 8.436 MiB | 20 |
| Q2 | B | 69 | 1 | 5 | 418.6 MiB | 23.459 MiB | 718 |
| Q3 | C | 14 | 1 | 4 | 169.3 MiB | 3.303 MiB | 1 |
| Q4 | D | 71 | 1 | 6 | 208.4 MiB | 25.885 MiB | 668 |
"Selected file bytes" is the full size of the Parquet files retained after Delta pruning. "S3 bytes received" is Delta Arrow Reader's median instrumented data-file traffic. The reader did not download each selected file in full.
Q2 makes the difference concrete. Delta statistics reduced a roughly 1.2-TiB table with over 18,000 files to five files. Those files totaled 418.6 MiB, but the reader fetched only 23.5 MiB of data-file bytes. The query returned 718 rows. Q4 reduced over 3,000 files to six and transferred 25.9 MiB from a table with roughly 200 GiB of active data.
What each engine ran
| Engine | Version | Execution location | Query timer |
|---|---|---|---|
| Lakehouse//RT (Beta) | Small, one cluster, Photon enabled | Databricks managed | SQL Connector execute through complete fetchall |
| Serverless SQL | Small, one cluster, Photon enabled | Databricks managed | SQL Connector execute through complete fetchall |
| Delta Arrow Reader | 0.6.0, DataFusion 54.1.0, Arrow/Parquet 58.4.0 | Local WSL2 process | DataFusion planning through complete stream consumption |
| delta-rs | 365fd2c, DataFusion 55.0.0, Arrow/Parquet 59.2.0 |
Local WSL2 process | DataFusion planning through complete stream consumption |
Every engine read the same pinned Delta snapshot for each table. The exact snapshot identifiers stay private because they could make the tables identifiable.
The managed timer includes statement queueing, execution, result transfer, and Arrow decoding. It excludes warehouse restart, connection setup, the session cache setting, and result fingerprinting. The local timer includes physical planning and full stream consumption. It excludes process startup, table initialization, and result fingerprinting.
Empty data caches, warm Delta metadata
This is an I/O-cache-neutral remote-read comparison. It is not broadly "cache-neutral," because Delta metadata and Parquet data are different caches.
Delta Arrow Reader loaded each table with eager scan metadata. Table initialization replayed the Delta log or checkpoint and retained the active file metadata and statistics. Queries reused that table-level metadata, then performed their own pruning and fetched Parquet metadata and data from S3. The reader had no query-result cache, Parquet data cache, or local disk cache.
Databricks does not expose a SQL setting that disables its managed I/O cache on
these warehouses. The benchmark therefore stopped and restarted each warehouse
before every four-query round. Each new SQL Connector session set and verified
use_cached_result=false. The private audit rejected statements with a missing
cache field, result_from_cache=true, or nonzero read_cache_bytes. All 72
managed executions, including warmups, passed these checks. Warehouse restart,
startup, and connection time remained outside the query timer.
Measurements collected after the managed I/O cache had been populated were excluded from the comparison. Comparing those warm-cache timings with local S3 reads would reward one side for doing less storage work.
Hardware context
The local benchmark ran inside WSL2 on a Dell laptop:
| Component | Local configuration |
|---|---|
| CPU | Intel Core Ultra 7 265H, 6 performance cores, 8 efficiency cores, 2 low-power efficiency cores, 16 threads |
| Host OS | Windows 11 Enterprise |
| Memory | 32 GiB installed; WSL limited to 20 GB and reported 19 GiB usable |
| Swap | WSL configured with 20 GB; neither local engine used swap |
| Guest | Ubuntu 24.04 LTS, kernel 6.6.87.2-microsoft-standard-WSL2 |
| Rust | 1.97.1 |
| Storage | 512 GB NVMe; no local table-data cache used |
| Network control | 140.392 Mbit/s public-S3 range probe, 0.257 s median time to first byte, measured immediately before the final local runs |
"Small" is only a service label unless its scale is explained. Databricks'
published sizing table
maps a Pro or Classic Small warehouse to one i3.4xlarge driver and four
i3.2xlarge workers. The
AWS I3 specification
puts that reference at 24 physical Broadwell cores, 48 vCPUs, and 366 GiB of
RAM in total. The worker pool accounts for 16 physical cores, 32 vCPUs, and
244 GiB of RAM.
That is a sizing reference, not the hardware assigned to these benchmark queries. Databricks says Serverless Small may use different instances but generally provides similar price/performance to the equivalent Pro or Classic size. It does not publish an RT hardware mapping. The backing CPU, memory, and storage topology of both tested managed services remain undisclosed.
CPU counts also need care. AWS defines one vCPU as one hardware thread, while Intel lists the 265H as 16 heterogeneous physical cores and 16 threads. The laptop therefore had the same physical core count as the published worker pool, not "half the compute." Core design, CPU generation, clocks, power limits, vector execution, and managed hardware all differ too much for that conversion.
The memory contrast is concrete even though the managed allocation is unknown: 19 GiB is 7.8% of the published worker-pool RAM and 5.2% of the whole published cluster RAM. The performance comparison remains the measured query latency, not a synthetic per-vCPU score.
Run order and correctness
Each engine ran one discarded warmup followed by eight measured rounds. Every round executed all four queries once. A four-treatment Williams order repeated twice placed every query in every position exactly twice, so first-query costs did not stay attached to one workload.
The two managed warehouses restarted before every round and opened a new SQL Connector session. Each local engine ran its complete nine-round session in a fresh process. Within that process, the four loaded tables stayed alive, matching a service that initializes its tables once and runs repeated queries.
All 144 executions, including warmups, produced the same normalized logical schema, row count, and typed order-independent result fingerprint for each query. The public artifact records the parity result but omits the schema and fingerprint values.
Initialization and memory
The local query timers exclude eager table initialization, so its cost is reported separately:
| Engine | Four-table initialization | RSS after metadata initialization | Maximum process RSS |
|---|---|---|---|
| Delta Arrow Reader | 12.033 s | 117.0 MiB | 431.1 MiB |
| delta-rs | 9.748 s | 115.1 MiB | 2,751.6 MiB |
Delta Arrow Reader paid 2.285 seconds more to initialize the four tables. Once queries began, its process peaked at 431.1 MiB. The delta-rs process peaked at 2.75 GiB, 6.4 times as much. Neither process swapped.
The similar 115-117 MiB post-initialization RSS also keeps the metadata result in perspective. The large peak-memory difference appeared while the queries ran; it was not caused by one engine retaining a dramatically larger Delta metadata snapshot.
What the numbers say
An Apache-2.0 reader running in WSL on a laptop with 19 GiB of usable memory beat Serverless SQL Small on application-facing latency for all four selective reads. It also reported fewer remote bytes on every query.
RT won three queries and the aggregate comparison, but it did not win by selecting fewer files or reading materially less data. Delta Arrow Reader matched its file selection, moved comparable or fewer reported bytes, and still reached S3 over a measured public-WAN path. RT's network and storage placement are undisclosed. The different network paths may account for a meaningful part of the remaining gap, but the benchmark cannot separate that effect from differences between the engines.
delta-rs was not competitive on the same machine. Delta Arrow Reader was faster on every query, up to 71.75 times faster, while delta-rs used 6.4 times as much peak memory. Supporting Delta Lake and DataFusion is not enough by itself; the read path determines whether a selective query takes milliseconds, seconds, or minutes.
Databricks keeps RT's implementation inside its service. Delta Arrow Reader's implementation, raw anonymized measurements, and chart generator are public. These results show that low-latency selective reads over Delta storage are not exclusive to a closed runtime.
Limits
- The tables and SQL are private. The public artifact is auditable but cannot reproduce the complete workload.
- Four selective projection-and-filter queries do not represent arbitrary SQL, concurrent clients, joins, writes, ETL, or full-table analytics.
- The exact Serverless and RT hardware, storage path, runtime build, and Delta metadata lifecycle are not exposed.
- Lakehouse//RT was in Beta when tested on August 31, 2026. Databricks notes that its performance and supported features may change before general availability.
- Local table initialization was measured separately and excluded from query latency. A one-shot caller that loads all four tables would pay that 12.033-second cost.
- The local runs crossed a public WAN to S3, and Q2 showed substantial network variability.
- The local engines used different DataFusion, Arrow, and Parquet versions.
- The benchmark reports no cost-normalized or CPU-normalized comparison.
- These results describe the pinned snapshots and software tested on August 31, 2026. They are not a universal performance promise.
Inspect the evidence
The sanitized CSV contains one row per engine, query, and round, including the discarded warmups. It contains enough data to recompute every median, range, and aggregate ratio on this page without revealing SQL, names, paths, literals, identifiers, or result fingerprints.
Validate the measurements and confirm that all eight generated SVG files match the CSV:
Run the script without --check to regenerate all four charts in light and
dark themes.
Independence
Delta Arrow Reader is an independent open-source project. It is not affiliated with or endorsed by Databricks.