
Optimizing Spark Window Functions: From 33 Minutes to 12 Minutes
Intro
I work for an MLB team, and we process massive amounts of baseball tracking data every day. Recently, we had a Spark job on Databricks that needed to join an enormous fact table (player tracking records with coordinates for each frame) with a dimensional table (position number to player uid mapping), then perform deduplication using a window function.
1. The Original Query
The core logic involved a window function to handle duplicate records (some psedudo SQL):
WITH ranked AS (
  SELECT
    tracking.*,
    lineup.fielder_id,
    lineup.position_alpha,
    ROW_NUMBER() OVER (
      PARTITION BY game_id, pitch_uid, position_num, event_time
      ORDER BY
        processed_year DESC,
        processed_month DESC,
        processed_day DESC,
        tie_breakers (x, y, z coordinates) -- tie_breaker: x, y, z coordinates
    ) AS rn
  FROM hawkeye_tracking tracking
  JOIN hawkeye_lineup lineup ON (...)
)
SELECT * EXCEPT (rn)
FROM ranked
WHERE rn = 1
Although the query itself doesn’t look complex, the long execution time of it raised some concerns. With the table sized at only a few hundred GB, why would it take over 30 mins to run on Databricks, even with a medium-sized SQL warehouse? Something’s clearly wrong here, so I dove into DBX’s query profile to investigate.
Warehouse Size Investigation: I tested the same query on both an x-small serverless warehouse and a medium warehouse, and surprisingly, the execution times were nearly identical (~33 minutes). This immediately suggested that the bottleneck wasn’t compute capacity but rather an algorithmic or I/O problem.
2. Query Profile Analysis
Looking at the query profile, I immediately spotted the issue:

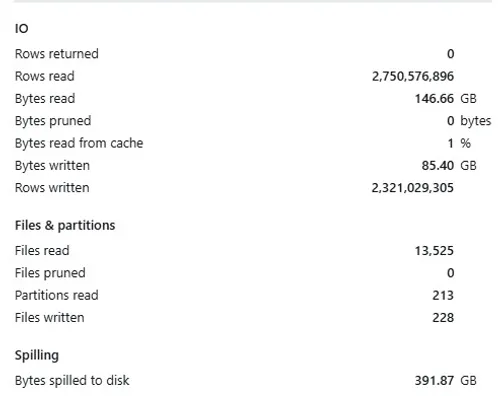
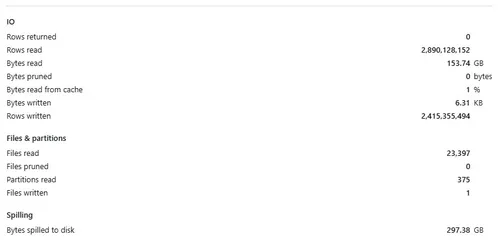
3. The Real Problem: Massive Disk Spilling
391.9 GB spilled to disk This was the biggest red flag. The query spilled nearly 400 GB to disk, which is almost 3x the amount of data actually read (146.66 GB). This indicates that Spark could not fit the intermediate results in memory and had to write them to disk repeatedly - a huge performance killer.
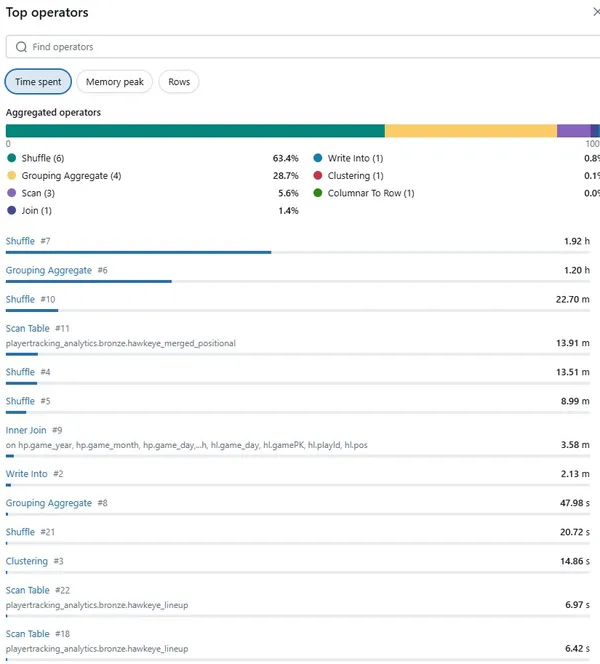
4. Digging Deeper: Top Operators Analysis
To understand what was causing this massive spilling, I clicked into the “Top operators” view:
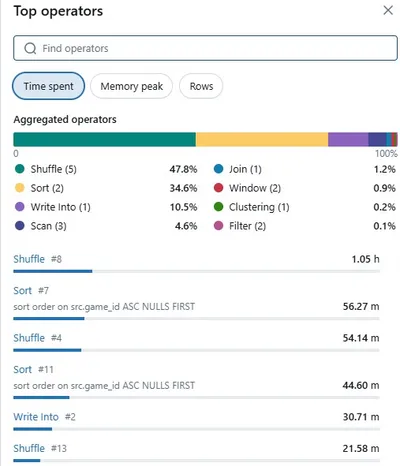
The analysis revealed:
- Shuffle operations consumed 47.8% of the total time (1.05 hours)
- Sort operations took 34.6% of the time (56.27 minutes)
- The window function was clearly the bottleneck
5. Root cause: Window Function Sorting Bottleneck
Clicking into Sort operation #11, I found the smoking gun:
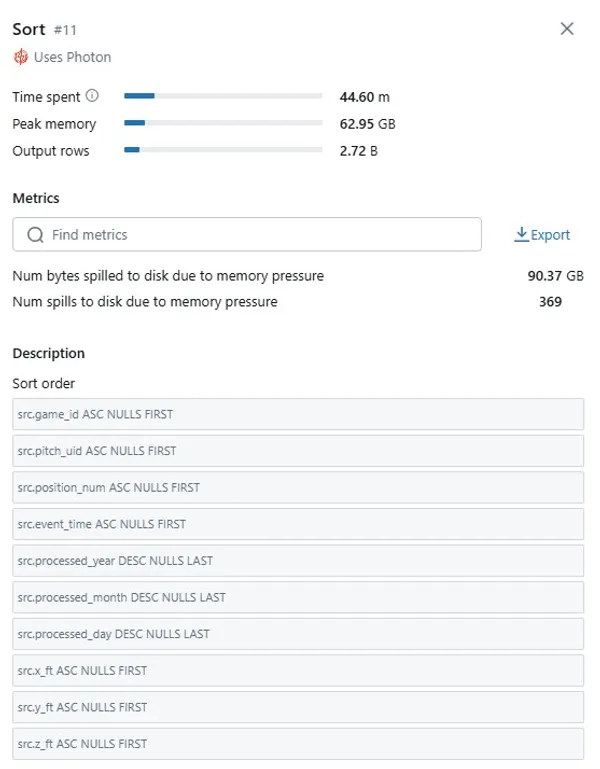
90.37 GB spilled to disk from this single sort operation! Looking at the sort order, it was exactly the ORDER BY clause from our ROW_NUMBER() window function:
src.game_id ASC NULLS FIRSTsrc.pitch_uid ASC NULLS FIRSTsrc.position_num ASC NULLS FIRSTsrc.event_time ASC NULLS FIRSTsrc.processed_year DESC NULLS LASTsrc.processed_month DESC NULLS LASTsrc.processed_day DESC NULLS LAST
This confirms that our window function’s ROW_NUMBER() OVER (PARTITION BY ... ORDER BY ...) was forcing Spark to:
- Shuffle all data by the partition keys
- Sort massive partitions by the ORDER BY clause
- Spill to disk when the sorted data exceeded memory
The combination of a large dataset with complex partitioning and sorting was overwhelming Spark’s memory management, causing the performance disaster we observed.
6. The Double Shuffle-Sort Mystery
But here’s what puzzled me initially: Why were there multiple shuffle operations consuming so much time?
Looking at the operations DAG here:
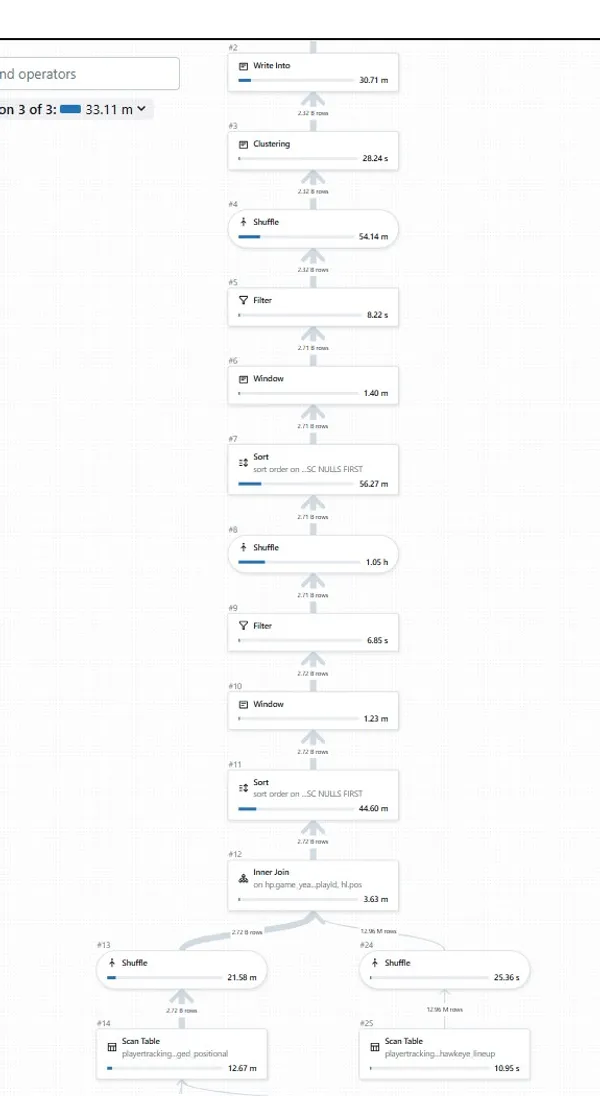
(huge sort on #11 and #7, massive shuffle on #8 and #4)
My first instinct was: “Is Spark doing a duplicate shuffle-sort? Why is that?“
7. Understanding What Happened: Sort-based Aggregation
To understand what went wrong, I needed to dig into how Spark handles large datasets. It turns out Spark has two strategies for aggregation:
Hash-based Aggregation (Preferred):
- Creates an in-memory hash table for each unique group key
- Updates aggregate values directly as it processes rows
- Fast because it avoids sorting
- Critical limitation: Requires all intermediate results to fit in memory
Sort-based Aggregation (Fallback):
- Used when hash-based aggregation fails due to memory constraints
- Process: Shuffle data by grouping keys → Sort within partitions → Aggregate
- Can handle larger datasets but much slower due to sorting overhead
Here’s what happened in our case: Our dataset was too large for hash-based aggregation, so Spark automatically fell back to sort-based aggregation. But we weren’t just doing simple aggregation—we also had a window function, which created a perfect storm.
8. The Double Penalty: Why We Had Multiple Sorts
Our query had both aggregation-like behavior AND a window function, which meant we got hit with a double penalty:
-
Sort-based aggregation phase: Because our intermediate results were too large for memory, Spark had to use sort-based aggregation for the preliminary data processing. This involved:
- Shuffling data by certain grouping keys
- Sorting within each partition to enable efficient aggregation
- Preparing data for the subsequent window function
-
Window function sorting phase: The
ROW_NUMBER()window function then required its own sorting operations:- Additional shuffle by the
PARTITION BYkeys (game_id,pitch_uid,position_num,event_time) - Additional sort within each partition by the
ORDER BYclause (processed_year DESC,processed_month DESC,processed_day DESC)
- Additional shuffle by the
So our execution plan looked like:
Data → Sort-based Agg Shuffle → Sort-based Agg Sort → Window Shuffle → Window Sort → ResultsEach arrow represents massive data movement with 2.3 billion rows, and each sort operation risked spilling to disk when memory was exceeded.
9. Why This Was So Expensive
The problem compounded because:
- Volume amplification: Each operation had to process the full 2.3 billion rows
- Memory pressure cascade: The first sort operation filled up memory, making subsequent operations more likely to spill
- Multiple network shuffles: Data moved across the cluster multiple times
- Disk I/O bottleneck: Once spilling started (391 GB!), the entire pipeline became I/O bound
This explains the performance characteristics we observed:
- Shuffle operations taking 47.8% of time: Multiple data redistribution phases
- Sort operations taking 34.6% of time: Multiple sorting phases with different criteria
- Warehouse size didn’t matter: Once you’re spilling hundreds of GBs to disk, more CPU cores can’t help
The combination of large dataset size, memory-constrained sort-based aggregation, AND window function requirements created a performance disaster where each operation made the next one worse.
10. The Real Problem: We Don’t Need Full Sorting!
Here’s the key insight: We’re doing way more work than necessary.
Our goal was simple: for each combination of game_id, pitch_uid, position_num, and event_time, we only wanted the record with the highest values of processed_year, processed_month, and processed_day.
But our ROW_NUMBER() window function forced Spark to:
- Shuffle all 2.3 billion rows by partition keys
- Fully sort each partition by the ORDER BY clause
- Assign row numbers to every single row
- Filter out everything except rn = 1
We were essentially sorting every row in each partition just to pick the “top 1”—that’s massively inefficient!
11. The Solution: max_by Function
After some research, I discovered that Spark 3.0+ introduced the max_by function, which is exactly what we need:
-- Instead of this expensive window function:
WITH ranked AS (
  SELECT
    tracking.*,
    lineup.fielder_id,
    lineup.position_alpha,
    ROW_NUMBER() OVER (
      PARTITION BY game_id, pitch_uid, position_num, event_time
      ORDER BY processed_year DESC, processed_month DESC, processed_day DESC
    ) AS rn
  FROM hawkeye_tracking tracking
  JOIN hawkeye_lineup lineup ON (...)
)
SELECT * EXCEPT (rn) FROM ranked WHERE rn = 1

-- We can use this much more efficient approach:
SELECT
  game_id,
  pitch_uid,
  position_num,
  event_time,
  MAX_BY(
    STRUCT(tracking.*, lineup.fielder_id, lineup.position_alpha),
    STRUCT(processed_year, processed_month, processed_day, tie_breakers)
  ).*
FROM hawkeye_tracking tracking
JOIN hawkeye_lineup lineup ON (...)
GROUP BY game_id, pitch_uid, position_num, event_time
12. How max_by Works Under the Hood
To understand why max_by is so much more efficient, I dug into the Spark source code. Here’s the key implementation from MaxByAndMinBy.scala:
/**
 * The shared abstract superclass for `MaxBy` and `MinBy` SQL aggregate functions.
 */
abstract class MaxMinBy extends DeclarativeAggregate with BinaryLike[Expression] {

  // The attributes used to keep extremum (max or min) and associated aggregated values.
  private lazy val extremumOrdering =
    AttributeReference("extremumOrdering", orderingExpr.dataType)()
  private lazy val valueWithExtremumOrdering =
    AttributeReference("valueWithExtremumOrdering", valueExpr.dataType)()

  override lazy val updateExpressions: Seq[Expression] = Seq(
    /* valueWithExtremumOrdering = */
    CaseWhen(
      (extremumOrdering.isNull && orderingExpr.isNull, nullValue) ::
        (extremumOrdering.isNull, valueExpr) ::
        (orderingExpr.isNull, valueWithExtremumOrdering) :: Nil,
      If(predicate(extremumOrdering, orderingExpr), valueWithExtremumOrdering, valueExpr)
    ),
    /* extremumOrdering = */ orderingUpdater(extremumOrdering, orderingExpr)
  )
}

case class MaxBy(valueExpr: Expression, orderingExpr: Expression) extends MaxMinBy {
  override def prettyName: String = "max_by"

  override protected def predicate(oldExpr: Expression, newExpr: Expression): Expression =
    oldExpr > newExpr

  override protected def orderingUpdater(oldExpr: Expression, newExpr: Expression): Expression =
    greatest(oldExpr, newExpr)
}
The key insight: Instead of collecting and sorting all rows in each partition, max_by uses an incremental aggregation approach:
-
For each partition, maintain only two values:
valueWithExtremumOrdering: The current “best” recordextremumOrdering: The current maximum ordering value
-
For each new row, do a simple comparison:
- If
new_ordering > current_max_ordering, update both values - Otherwise, keep the current values
- If
-
No sorting required: Just O(1) comparisons per row instead of O(n log n) sorting
This means:
- Memory usage: O(1) per partition instead of O(n)
- CPU complexity: O(n) instead of O(n log n)
- Less disk spilling: The intermediate state fits more easily in memory
13. Packed Ordering Key Optimisation
And to further optimize the performance of the query, we can even convert the struct we used for ord key into a single int64 with bit manipulation, so that the comparison between records is even faster.
-- instead of directly using this expression
MAX_BY(
    STRUCT(tracking.*, lineup.fielder_id, lineup.position_alpha),
    STRUCT(processed_year, processed_month, processed_day, tie_breakers)
  ).*


-- we convert the STRUCT(processed_year, processed_month, processed_day, tie_breakers) into one single int64

scored AS (
  SELECT
    *,
    -- days since 2000-01-01  (newer date ⇒ larger value)
    datediff(
      to_date('2000-01-01'),
      to_date(
        concat(
          processed_year,
          '-',
          processed_month,
          '-',
          processed_day
        )
      )
    ) * -1 AS date_key,
    -- millifeet integers, inverted so that smaller coords win
    CAST(262143 - ROUND(x_ft * 1000) AS BIGINT) AS x_inv,
    -- BIGINT
    CAST(262143 - ROUND(y_ft * 1000) AS BIGINT) AS y_inv,
    CAST(8191 - ROUND(z_ft * 1000) AS BIGINT) AS z_inv
  FROM
    hashed
),
keys_only as (
  SELECT
    game_id,
    pitch_uid,
    position_num,
    event_time,
    pos_id64,
    /* 64-bit packed ordering key */
    (
      SHIFTLEFT(CAST(date_key AS BIGINT), 49) | SHIFTLEFT(x_inv, 31) | SHIFTLEFT(y_inv, 13) | z_inv
    ) AS ord_key
  FROM
    scored
),
winner AS (
  -- hash aggregate, no spill
  SELECT
    MAX_BY(pos_id64, ord_key) AS pos_id64_winner,
    game_id,
    pitch_uid,
    position_num,
    event_time
  FROM
    keys_only
  GROUP BY
    game_id,
    pitch_uid,
    position_num,
    event_time
)
14. Hash-Agg vs Sort-Agg Deep Dive
So this removed the sorting inside the window function, but what about the sorting before it? In another word, how can we make sure we are using hash agg instead of sort agg?
Although Spark doesn’t directly expose an option for us to choose which one to use and supposely would just pick hash agg whenever it’s possible, let’s check Spark’s source code again to confirm.
from Spark’s AggUtils.scala module we can see:
private def createAggregate(
      requiredChildDistributionExpressions: Option[Seq[Expression]] = None,
      isStreaming: Boolean = false,
      groupingExpressions: Seq[NamedExpression] = Nil,
      aggregateExpressions: Seq[AggregateExpression] = Nil,
      aggregateAttributes: Seq[Attribute] = Nil,
      initialInputBufferOffset: Int = 0,
      resultExpressions: Seq[NamedExpression] = Nil,
      child: SparkPlan): SparkPlan = {
    val useHash = Aggregate.supportsHashAggregate(
      aggregateExpressions.flatMap(_.aggregateFunction.aggBufferAttributes), groupingExpressions)

    val forceObjHashAggregate = forceApplyObjectHashAggregate(child.conf)
    val forceSortAggregate = forceApplySortAggregate(child.conf)

    if (useHash && !forceSortAggregate && !forceObjHashAggregate) {
      HashAggregateExec(
        requiredChildDistributionExpressions = requiredChildDistributionExpressions,
        isStreaming = isStreaming,
        numShufflePartitions = None,
        groupingExpressions = groupingExpressions,
        aggregateExpressions = mayRemoveAggFilters(aggregateExpressions),
        aggregateAttributes = aggregateAttributes,
        initialInputBufferOffset = initialInputBufferOffset,
        resultExpressions = resultExpressions,
        child = child)
    } else {
      val objectHashEnabled = child.conf.useObjectHashAggregation
      val useObjectHash = Aggregate.supportsObjectHashAggregate(
        aggregateExpressions, groupingExpressions)

      if (forceObjHashAggregate || (objectHashEnabled && useObjectHash && !forceSortAggregate)) {
        ObjectHashAggregateExec(
          requiredChildDistributionExpressions = requiredChildDistributionExpressions,
          isStreaming = isStreaming,
          numShufflePartitions = None,
          groupingExpressions = groupingExpressions,
          aggregateExpressions = mayRemoveAggFilters(aggregateExpressions),
          aggregateAttributes = aggregateAttributes,
          initialInputBufferOffset = initialInputBufferOffset,
          resultExpressions = resultExpressions,
          child = child)
      } else {
        SortAggregateExec(
          requiredChildDistributionExpressions = requiredChildDistributionExpressions,
          isStreaming = isStreaming,
          numShufflePartitions = None,
          groupingExpressions = groupingExpressions,
          aggregateExpressions = mayRemoveAggFilters(aggregateExpressions),
          aggregateAttributes = aggregateAttributes,
          initialInputBufferOffset = initialInputBufferOffset,
          resultExpressions = resultExpressions,
          child = child)
      }
    }
  }
to understand what’s Aggregate.supportsHashAggregate, we found the basicLogicalOperators.scala as:
def supportsHashAggregate(
      aggregateBufferAttributes: Seq[Attribute], groupingExpression: Seq[Expression]): Boolean = {
    val aggregationBufferSchema = DataTypeUtils.fromAttributes(aggregateBufferAttributes)
    isAggregateBufferMutable(aggregationBufferSchema) &&
      groupingExpression.forall(e => UnsafeRowUtils.isBinaryStable(e.dataType))
  }
which means for the agg buffer describing all the fields from the function has to be mutable, and every grouping expressions’s data type has to be binary stable.
mutable:
based on source code from here:
public static boolean isMutable(DataType dt) {
    if (dt instanceof UserDefinedType udt) {
      return isMutable(udt.sqlType());
    }
    PhysicalDataType pdt = PhysicalDataType.apply(dt);
    return pdt instanceof PhysicalPrimitiveType || pdt instanceof PhysicalDecimalType ||
      pdt instanceof PhysicalCalendarIntervalType;
  }
only these data types are considered as mutable:
- PhysicalPrimitiveType: which includes:
- PhysicalBooleanType
- PhysicalByteType
- PhysicalShortType
- PhysicalIntegerType
- PhysicalLongType
- PhysicalFloatType
- PhysicalDoubleType
- PhysicalNullType
-
PhysicalDecimalType
-
PhysicalCalendarIntervalType
binary stable:
from the source code here:
def isBinaryStable(dataType: DataType): Boolean = !dataType.existsRecursively {
    case st: StringType =>
      !st.supportsBinaryEquality
    case _ => false
  }
and from here:
we know that for supportsBinaryEquality:
private[sql] def supportsBinaryEquality: Boolean =
    collationId == CollationFactory.UTF8_BINARY_COLLATION_ID ||
      CollationFactory.fetchCollation(collationId).supportsBinaryEquality
so it seems like as long as we don’t use a different collation than utf8_binary then all the strings should be binary stable.
Unfortunately because we have string types in our fields of our max_by function and they are not mutable, a typical hash agg is not feasible for our scenario.
15. Object-Hash Benchmark
But Spark do have a different middle ground type of agg that’s called ObjectHashAggregate that they introduced since version 2.2.0.
Unlike the HashAggregateExec which stores aggregation buffers in the UnsafeRow in off-heap memory, the ObjectHashAggregateExec stores the aggregation buffers in the SpecificInternalRow which internally holds a Java Array collection of aggregation buffer fields in Java heap memory.
The ObjectHashAggregateExec uses an ObjectAggregationMap instance as the hash map instead of the UnsafeFixedWidthAggregationMap used by the HashAggregateExec. The ObjectAggregationMap supports storing arbitrary Java objects as aggregate buffer values.
But for our use case, because our grouping key has really high cardinality ( over a couple hundreds of millions), the ObjectHashAgg method would consume much more RAM since it creates java object for each record, also brings enormous pressure to the JVM GC as they are stored on-heap.
But still I do tested the same SQL query between a sort agg and a object hash agg:
import time
from pyspark.sql import functions as F

# 1) Warm up the cache of 'scored' so both experiments start from memory
print("Warming up scored cache…")
scored.count()

# 2) the same agg_sql as before, using unpacked primitives and 'ord'
agg_sql = """
SELECT struct(
    ...
) AS picked_row
FROM (
  SELECT *,
    (SHIFTLEFT(date_key,49)
     | SHIFTLEFT(x_inv,31)
     | SHIFTLEFT(y_inv,13)
     | z_inv) AS ord
  FROM scored
) t
GROUP BY game_id, pitch_uid, position_num, event_time
"""
spark.conf.set("spark.sql.objectHashAggregate.sortBased.fallbackThreshold", 1000000000)

def bench(label, use_obj_hash: bool):
    spark.conf.set("spark.sql.execution.useObjectHashAggregate", str(use_obj_hash).lower())
    start = time.time()
    cnt = spark.sql(agg_sql).count()
    print(f"{label:>20} (useObjectHash={use_obj_hash}): {time.time()-start:.1f}s, rows={cnt}")

# 3) Benchmark sort-based vs object-hash back-to-back
bench("Sort-based",     False)
bench("Object-hash-agg", True)
and the diff is not that significant:
Warming up scored cache…
Sort-based (useObjectHash=False): 47.7s, rows=274967745
Object-hash-agg (useObjectHash=True): 41.5s, rows=274967745
Like I said, the object hash agg way would take more RAM and give more pressure to the JVM GC, so not that ideal for our scenario where the grouping key cardinality is super high.
16. Post-Optimisation Results (12-min Run)
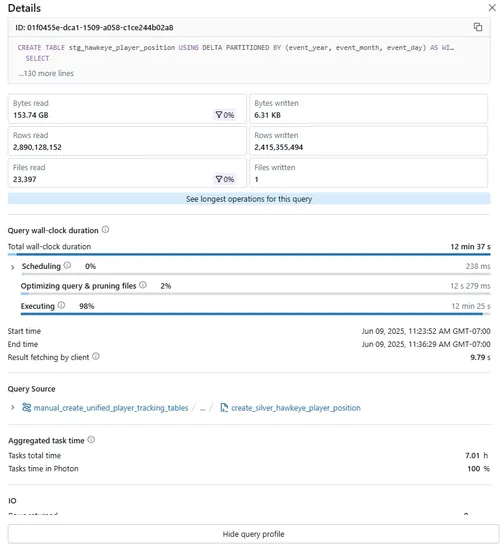
Key takeaways after replacing ROW_NUMBER() with max_by:
| Metric | Before | After |
|---|---|---|
| Wall-clock time | ~33 min | 12 min 37 s |
| Disk spill | 391 GB | 297 GB |
| Top operator | Sort (34 %) | Shuffle (63 %) |
| Warehouse size sensitivity | None | Still I/O-bound but 2.7x faster |
Why some spill remains: Serverless SQL warehouses use fixed executor sizes. With 2.9 b rows, the grouping hash map still evicts pages to disk. A classic cluster with beefier executors runs spill-free.